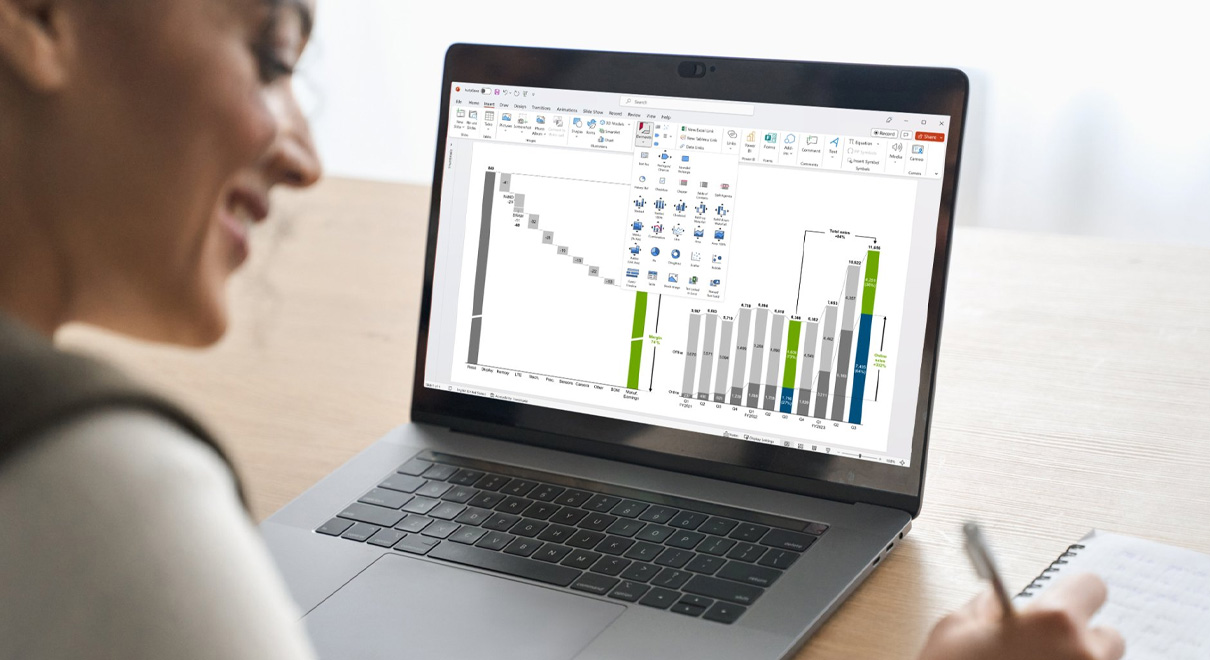
The Importance of Data Visualization
Data visualization is the art and science of communicating information through visual representations such as charts, graphs, and infographics. It transforms complex data into easily understandable and digestible formats, making it easier to identify trends, patterns, and anomalies. Effective data visualization can help businesses communicate key insights to stakeholders, improve decision-making, and drive better business outcomes.
Why is Data Visualization Important?
Enhanced Understanding:
- The human brain is inherently visual. Data visualization makes it much easier to understand and interpret complex data than simply looking at rows and columns of numbers.
- Visuals can quickly convey key messages, reveal hidden patterns, and highlight important trends that might be missed in raw data.
Improved Communication:
- Data visualizations are a powerful tool for communicating data insights to a wide range of audiences, from executives to colleagues and clients.
- Visuals can help to tell compelling stories with data, making it easier to understand and engage with complex information.
Better Decision Making:
- By presenting data in a clear and concise visual format, data visualization can help decision-makers quickly identify key issues, assess risks, and make informed choices.
- Interactive visualizations can also enable users to explore data in more depth, allowing for deeper insights and more informed decisions.
Increased Engagement:
- Data visualizations can make data more engaging and interesting to explore.
- Interactive dashboards and visualizations can encourage users to interact with the data and gain a deeper understanding of the underlying information.
Improved Collaboration:
By providing a shared visual understanding of data, teams can more easily identify areas of agreement and disagreement, and work together to find solutions.
Types of Data Visualizations:
- Charts and Graphs:
- Line charts, bar charts, pie charts, scatter plots, and histograms are common types of charts used to visualize data.
- Maps:
- Maps are used to visualize geographical data, such as sales by region or customer locations.
- Infographics:
- Infographics combine data with visuals, such as images and icons, to create engaging and informative presentations.
- Dashboards:
- Dashboards provide a centralized view of key performance indicators (KPIs) and other important data, often in real-time.
Tools for Data Visualization:
- Business Intelligence (BI) Tools:
- Tableau, Power BI, and Qlik Sense are popular BI tools that offer a wide range of data visualization capabilities.
- Spreadsheet Software:
- Excel and Google Sheets offer basic data visualization features, such as charts and graphs.
- Data Visualization Libraries:
- Libraries like D3.js and Plotly allow developers to create highly customized and interactive visualizations.
In Conclusion
Data visualization is a critical skill in today’s data-driven world. By effectively communicating data through visual representations, businesses can make better decisions, improve communication, and gain a competitive advantage.


Social List